
Observability & OpenTelemetry in the .NET Environment
Observability makes it possible to understand the state of complex systems based on their outputs. This is indispensable for operation and error analysis, especially in distributed systems.
Since we demand high-quality code that is maintainable and extensible, observability is a fixed component for us. We rely on OpenTelemetry as the standard.
In this blog post, we provide a compact overview of observability in the .NET environment and share our experiences.
The 3 Pillars of Observability
By combining all three observability pillars: metrics, traces, and logs, development and operations teams gain comprehensive and detailed insight into the behavior of complex systems.
Together, they enable faster problem detection and resolution, provide complementary tools, improve system performance, and create the basis for full-stack observability—to keep everything in view from the frontend and backend to the infrastructure.
Metrics: the "What" in the system
Metrics provide quantitative measurements that represent the behavior of a system over time.
They are frequently aggregated to enable a clear representation in dashboards and visualizations such as time-series diagrams. Metrics are essential for setting up alerts and offer valuable insights into system performance, resource utilization, and overall health.
Their main purpose is to determine "what" is happening in the system (normal operation, limitation, error).
Typical examples of metrics include:
- Host metrics: Memory consumption, disk usage, CPU utilization
- Network metrics: Uptime, latency, throughput
- Application metrics: Response times, request and error rates
- Server pool metrics: Number of total and active instances
- External dependency metrics: Availability, service status
Pro Tip:
For .NET, we recommend integrating OpenTelemetry Metrics or Prometheus.NET, combined with Grafana for visualizations.
Logs: the "Why" behind events
Logs are immutable, detailed records of individual events and provide the context for root cause analysis. Protocols typically contain:
- Timestamps
- Transaction IDs
- IP and user IDs
- Event details and flow information
- Error messages
- Connection attempts
- Configuration changes
They capture important events, errors, and warnings, making it possible to trace system behavior over time.
Another important aspect of logs is log levels. These allow events to be summarized into specific groups. Based on our experience, the following log levels have proven effective:
- Debug: Developer information
- Info: Normal operation
- Warning: Abnormalities
- Error: Errors
By correlating with traces (e.g., via Trace ID and Span ID), processes can be analyzed even more precisely.
Pro Tip:
Use structured logs (e.g., JSON) and proven frameworks like Serilog or NLog. This allows logs not only to be evaluated flexibly but also to be specifically filtered by fields—ideal for central log management systems and targeted analyses.
Traces: the "Where and How" in the system
Traces record the flow of a request across multiple components of a distributed system. They help identify bottlenecks, latencies, and sources of error by making it clear what happened before and after an event.
Traces enable:
- Analysis of the duration of network operations
- Tracking of data flow through the system architecture
- Reconstruction of the sequence in which services are traversed
- Identification of root causes, bottlenecks, and latency problems
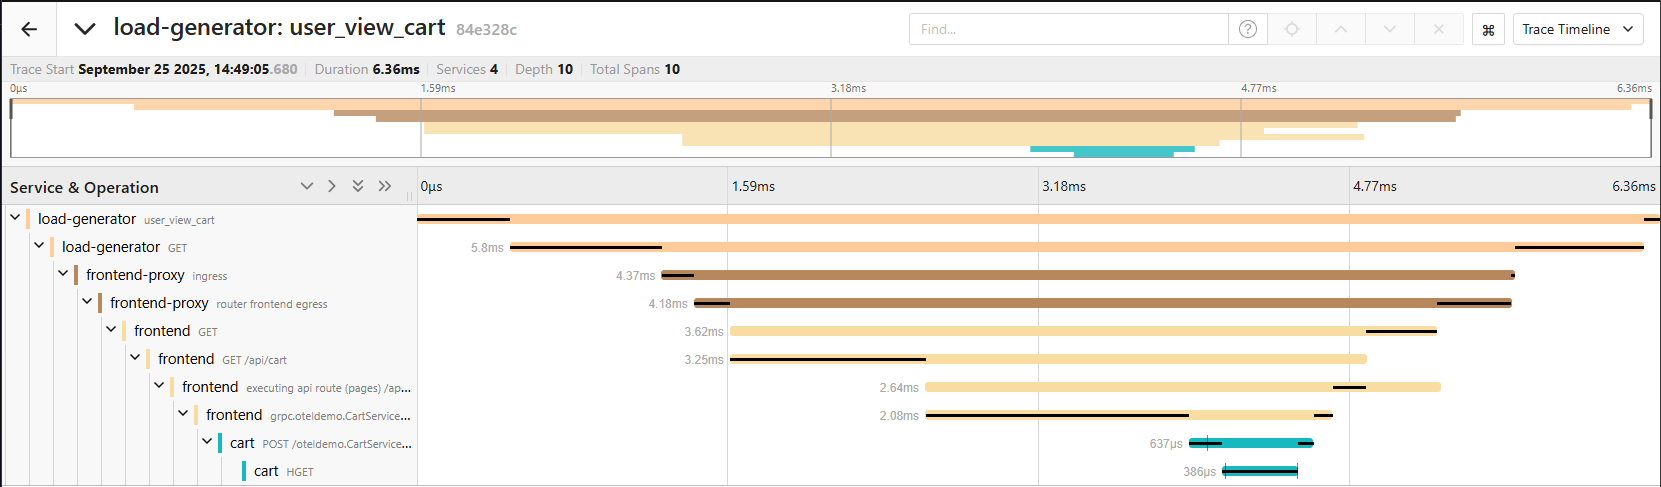
They combine aspects of metrics and logs by providing contextual information about the lifecycle of a request. The entire path of a request is made visible—including all involved components and their respective processing times.
Traces are particularly helpful for DevOps and development teams, as they make complex processes transparent and facilitate root cause analysis during system disruptions.
Pro Tip:
For distributed systems, OpenTelemetry Tracing with exporters like Jaeger or Zipkin is the standard. Auto-instrumentation covers some standard cases, but as soon as you have individual requirements—such as business logic relevance, special messaging systems, or additional context information—it is no longer sufficient.
Plan sufficient time for manual instrumentation and clean context propagation.
This is not "Plug & Play" but requires targeted implementation and coding.
Comparison of Implementation Effort and Benefit
| Pillar | Implementation Effort | Benefit |
|---|---|---|
| Logs | Low | Root cause analysis, error context |
| Metrics | Medium | Performance monitoring, alerting |
| Traces | High | End-to-end transparency, bottleneck analysis |
- Logs and metrics are the "low-hanging fruits" of observability, as they are implemented with little effort and already allow for the identification of anomalies, errors, and the monitoring of performance indicators.
- Traces are extremely helpful for distributed systems and debugging, but they are also significantly more complex to implement.
OpenTelemetry
The first part introduced the basics of the three pillars of observability. The following section explains the implementation using OpenTelemetry as the de facto standard for observability.
OpenTelemetry is a powerful open-source framework that provides a unified and standardized method for collecting, processing, and forwarding telemetry data such as metrics, logs, and traces. Here are the main advantages:
- Vendor Neutrality
It is independent of commercial providers and supports a variety of programming languages, offering developers maximum flexibility when integrating into existing system landscapes. This means: whether you use Jaeger, Prometheus, or Grafana, OpenTelemetry integrates seamlessly.
- Standardization across Languages
OpenTelemetry provides stable APIs and SDKs for many common programming languages, ensuring consistent implementations across different technology stacks. For .NET, all three areas are stable, making it ideal for productive implementation.
| Language | Traces | Metrics | Logs |
|---|---|---|---|
| C++ | Stable | Stable | Stable |
| C#/.Net | Stable | Stable | Stable |
| Erlang/Elixir | Stable | Development | Development |
| Go | Stable | Stable | Beta |
| Java | Stable | Stable | Stable |
| JavaScript | Stable | Stable | Development |
| PHP | Stable | Stable | Stable |
| Python | Stable | Stable | Development |
| Ruby | Stable | Development | Development |
| Rust | Beta | Beta | Beta |
| Swift | Stable | Development | Development |
- Flexibility and Extensibility
OpenTelemetry supports various data formats and backend systems like Prometheus, Jaeger, Zipkin, Grafana, or Elastic, allowing telemetry data to be easily integrated into existing monitoring and analysis platforms. Thanks to the modular architecture, OpenTelemetry can be easily extended, for example through custom instrumentations or exporters. Switching the backend is also straightforward, as the instrumentation remains unchanged and only the exporter or collector configuration needs to be adjusted.
OTELCollector
The OpenTelemetry Collector is a central component. The OTEL Collector collects, processes, and forwards telemetry data such as metrics, logs, and traces. It runs as a standalone service and enables the separation of instrumentation and backend, thereby increasing flexibility and scalability.
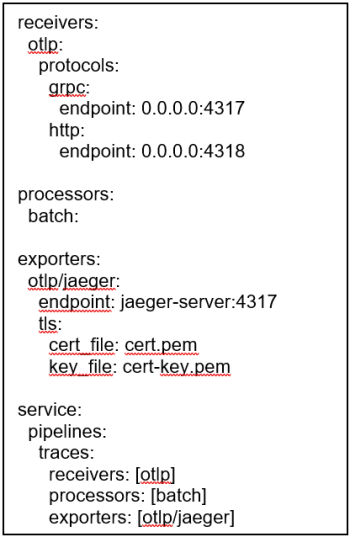
The collector can be configured as needed; the configuration on the left creates a trace pipeline that receives traces via OTLP, processes them via batch, and exports them via TLS to a Jaeger server.
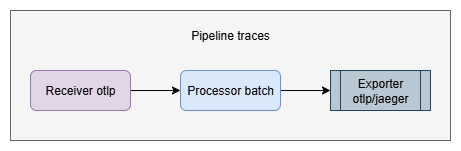
- Pipeline
A pipeline in the collector describes the path telemetry data takes—from reception through processing to export. It consists of several modular components (receivers, processors, exporters) that are configurable and perform different tasks.
- Receivers
Receivers are the entry points of the pipeline. They receive telemetry data from various sources, e.g., from applications, agents, or other collectors, and forward the data to the pipeline. Examples include OTLP, Prometheus, or Jaeger receivers.
- Processors
Processor components process the received data within the pipeline. They can enrich, filter, group, or transform data. Typical tasks include removing sensitive information or adding attributes.
- Exporters
Exporters are the exit points of the pipeline. They send the processed telemetry data to a destination system such as an observability backend (e.g., Grafana, Jaeger, Datadog, or Prometheus), where the data can be stored and analyzed.
Conclusion
- Observability is indispensable for operating distributed systems; without it, you are "blind."
- Start small and grow with complexity: Begin with logs and metrics and add traces when necessary. The relevance of the data must also be considered; more data does not automatically mean more insights. Data must be chosen deliberately, and subsequent analyses must be designed accordingly.
- Structured logs (e.g., in JSON format) are an important basis for efficient evaluation and facilitate automated processing, such as filtering, alerting, or analysis in central log systems.
- OpenTelemetry significantly simplifies implementation through standardization and does so without restricting flexibility (vendor neutrality).
- In combination with the OTLP Collector, instrumentation can be separated from the backend, resulting in a scalable and future-proof observability architecture.

Patrick Heiniger
Certified Technician HF in Informatics / Post-Graduate Diploma (NDS) in Software Engineering SWS
Software Engineer
About the author
Patrick Heiniger has been working as a Software Engineer at CSA for over 19 years.
He supports customers in the application sector with architecture and development for web and cloud projects, as well as across the broader .NET environment. His interest in emerging technologies and his motivation for continuous professional development have enabled him to cover a wide range of expertise.