Efficient Tracing on Target
Logging frameworks are standard on PCs. However, a configurable real-time tracer on an embedded system would be really helpful!
Problems faced by an embedded developer
Time and again, I come up against challenges when debugging on an embedded device. The debugger is not readily available or limits the code in such a way that the problem no longer occurs. In this situation, you find yourself retuning to good old printf (traces). This works well with just a few traces but if the program gets more complex I can no longer see the wood for the trees. What’s more, the traces use up a lot of program memory and have a major effect on the runtime of my program.
Possible solution
To save space on the device, the static part of the trace – i.e. the format string – is not integrated into the program code, but written into a separate file that is not loaded onto the device. Then only an ID is transmitted which is used to find the relevant string in the file. A string as long as this blog post would be reduced to a few bytes.
Running printf on the device is time-consuming because the arguments are evaluated during runtime. By using a binary protocol for data transmission, the arguments are transmitted directly without further processing. This reduces the computing effort and thus the time required on the device, resulting in a high transmission efficiency. The printf output is finally compiled on the PC.
Data transmission via a serial interface still takes a relatively long time and this affects the behaviour of the program. This can alter the program’s behaviour, particularly in an interrupt context. By using a queue that is processed in the background, the production of the trace is decoupled from the data transmission. To ensure that the chronological sequence of the trace can still be traced, a time stamp from a hardware timer is added when the trace is generated.
A temporal comparison between a regular printf of the string “hello world” and a trace using decoupled data transmission of a trace ID showed that the latter is about 50 times faster. On the embedded target, there are processor cycles that we need in the actual application and prefer not to waste on debug info.
To deal with the wood for the trees problem, trace modules and trace levels can be defined and activated/deactivated during runtime. Accordingly, only the selected traces are generated. This allows the developer to focus very precisely on debugging the part of the program that is directly relevant without having to recompile the program. The overhead that arises from analysing the selected modules/levels is approximately 10% compared to generating the trace and is therefore very low.
Tracing tool in action
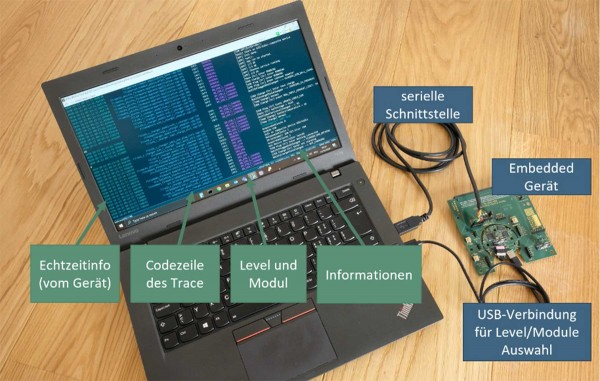 This tracing framework one of the main tools that I use when developing on embedded devices. It massively increases my efficiency as additional information is available alongside the usual trace information. Thanks to the time information, real-time problems can be analysed. Since the length of the string has no effect on the transmission, the file and code line of the trace call can also be displayed.
Thanks to the modules and levels, which are displayed in different colours, you can keep track of everything and use filters to quickly find the information you need. Solving problems is our job. Thanks to this framework, I can focus on the actual problems and reach a solution more efficiently.